BIN-PHYLO-Tree analysis
Title
Keywords: Species trees, gene trees and the importance of naming, Speciation and duplication signatures
Contents
This unit is under development. There is some contents here but it is incomplete and/or may change significantly: links may lead to nowhere, the contents is likely going to be rearranged, and objectives, deliverables etc. may be incomplete or missing. Do not work with this material until it is updated to "live" status.
Abstract
The analysis of mixed gene trees.
This unit ...
Prerequisites
You need to complete the following units before beginning this one:
Objectives
This unit will ...
- ... introduce ;
- ... demonstrate ;
- ... teach ;
Outcomes
After working through this unit you ...
- ... can ;
- ... are familar with ;
- ... have begun to.
Deliverables
- Time management: Before you begin, estimate how long it will take you to complete this unit. Then, record in your course journal: the number of hours you estimated, the number of hours you worked on the unit, and the amount of time that passed between start and completion of this unit.
- Journal: Document your progress in your Course Journal. Some tasks may ask you to include specific items in your journal. Don't overlook these.
- Insights: If you find something particularly noteworthy about this unit, make a note in your insights! page.
Evaluation
Evaluation: NA
- This unit is not evaluated for course marks.
Contents
Task:
- Read the introductory notes on analysing phylogenetic trees.
Analysis
Analysing your tree
In order to analyse your tree, you need a species tree as reference. This really is an absolute prerequisite to make your expectations about the observed tree explicit. Fortunately we have all species nicely documented in our database.
The reference species tree
Task:
- Navigate to the NCBI Taxonomy page
- Execute the following R command to create an Entrez command that will retrieve all taxonomy records for the species in your database:
cat(paste(paste(c(myDB$taxonomy$ID, "83333"), "[taxid]", sep=""), collapse=" OR "))- Copy the Entrez command, and enter it into the search field of the NCBI taxonomy page. Click on Search. The resulting page should have twelve species listed - ten "reference" fungi, E. coli (as the outgroup), and MYSPE. Make sure MYSPE is included! If it's not there, you did something wrong that needs to be fixed.
- Click on the Summary options near the top-left of the page, and select Common Tree. This places all the species into the universal tree of life and identifies their relationships.
- At the top, there is an option to Save as ... and the option to select a format to save the tree in. Select Phylip Tree as the format and click the Save as button. The file
phyliptree.phywill be downloaded to your computer into your default download directory. Move it to the directory you have defined asPROJECTDIR.
- Open the file in a text-editor. This is a tree, specified in the so-called "Newick format". The topology of the tree is defined through the brackets, and the branch-lengths are all the same: this is a cladogram, not a phylogram. The tree contains the long names for the species/strains and for our purposes we really need the "biCodes" instead. I can't think of a very elegant way to make that change programmatically, so just go ahead and replace the species names (not the taxonomic ranks though) with their biCode in your text editor. Remove all the single quotes, and replace any remaining blanks in names with an underscore. Take care however not to delete any colons or parentheses. Save the file.
My version looks like this - Your version must have MYSPE somewhere in the tree..
(
'ESCCO':4,
(
(
'PUCGR':4,
'USTMA':4,
(
'WALME':4,
'COPCI':4,
'CRYNE':4
)Agaricomycotina:4
)Basidiomycota:4,
(
(
(
'ASPNI':4,
'BIPOR':4,
'NEUCR':4
)leotiomyceta:4,
'SACCE':4
)saccharomyceta:4,
'SCHPO':4
)Ascomycota:4
)Dikarya:4
)'cellular organisms':4;
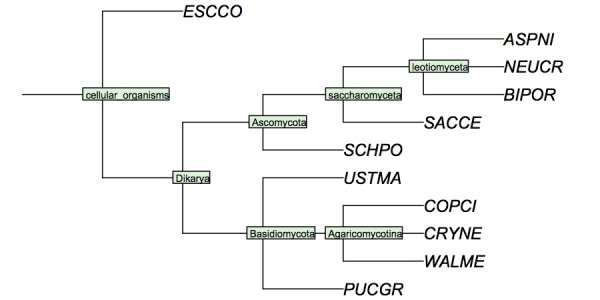
- Now read the tree in R and plot it.
# Download the EDITED phyliptree.phy
orgTree <- read.tree("phyliptree.phy")

# Plot the tree in a new window
dev.new(width=6, height=3)
plot(orgTree, cex=1.0, root.edge=TRUE, no.margin=TRUE)
nodelabels(text=orgTree$node.label, cex=0.6, adj=0.2, bg="#D4F2DA")
I have constructed a cladogram for many of the species we are analysing, based on data published for 1551 fungal ribosomal sequences. The six reference species are included. Such reference trees from rRNA data are a standard method of phylogenetic analysis, supported by the assumption that rRNA sequences are monophyletic and have evolved under comparable selective pressure in all species.
Cladogram of the "reference" fungi studied in the assignments. This cladogram is based on a tree returned by the NCBI Common Tree. It is thus a digest of cladistic relationships, not a representation of a specific molecular phylogeny.
Alternatively, you can look up your species in the latest version of the species tree for the fungi and add it to the tree by hand while resolving the trifurcations. See:
| Ebersberger et al. (2012) A consistent phylogenetic backbone for the fungi. Mol Biol Evol 29:1319-34. (pmid: 22114356) |
Task:
- Return to the RStudio project and continue with the script to its end. Note the deliverable at the end: to print out your trees and bring them to class.
Self-evaluation
If in doubt, ask! If anything about this learning unit is not clear to you, do not proceed blindly but ask for clarification. Post your question on the course mailing list: others are likely to have similar problems. Or send an email to your instructor.
About ...
Author:
- Boris Steipe <boris.steipe@utoronto.ca>
Created:
- 2017-08-05
Modified:
- 2017-10-31
Version:
- 1.0
Version history:
- 1.0 First live version.
- 0.1 First stub
![]() This copyrighted material is licensed under a Creative Commons Attribution 4.0 International License. Follow the link to learn more.
This copyrighted material is licensed under a Creative Commons Attribution 4.0 International License. Follow the link to learn more.
