Difference between revisions of "BIO Assignment Week 5"
m |
m |
||
| Line 9: | Line 9: | ||
</tr></table> | </tr></table> | ||
| − | {{Template: | + | {{Template:Inactive}} |
<small>Concepts and activities (and reading, if applicable) for this assignment will be topics on the upcoming quiz.</small> | <small>Concepts and activities (and reading, if applicable) for this assignment will be topics on the upcoming quiz.</small> | ||
Revision as of 04:52, 26 October 2015
Assignment for Week 5
Structure Analysis
| < Assignment 4 | Assignment 6 > |
Note! This assignment is currently inactive. Major and minor unannounced changes may be made at any time.
Concepts and activities (and reading, if applicable) for this assignment will be topics on the upcoming quiz.
Contents
- How could the search for ultimate truth have revealed so hideous and visceral-looking an object?
- Max Perutz (on his first glimpse of the Hemoglobin structure)
Introduction
Where is the hidden beauty in structure, and where, the "ultimate truth"? In the previous assignments we have discovered homologues of APSES domain containing proteins in all fungal species. This makes the domain an ancient protein family that had already duplicated to several paralogues at the time when the cenancestor of all fungi lived, more than 600,000,000 years ago, in the Vendian period of the Proterozoic era of Precambrian times.
In this assignment we will explore its molecular structure.
Molecular graphics: UCSF Chimera
To view molecular structures, we need a tool to visualize the three dimensional relationships of atoms. A molecular viewer is a program that takes 3D structure data and allows you to display and explore it. For a number of reasons, I use the UCSF Chimera viewer for this course:
- Chimera is free and open;
- It creates very appealing graphics;
- It is under ongoing development and is well maintained;
- It provides an array of useful utilities for structure analysis; and,
- besides an intuitive, menu driven interface, Chimera can be scripted via its command line, or even programmed via its in-built python interpreter.
Task:
- Access the Chimera homepage and navigate to the Download section.
- Find the the newest version for your platform in the table and click on the file to download it.
- Follow the instructions to install Chimera.
Let's explore Chimera functions first with a simple small molecule:
Modeling small molecules
"Small" molecules are solvent, ligands, substrates, products, prosthetic groups, drugs - in short, essentially everything that is not made by DNA-, RNA-polymerases or the ribosome. Whereas the biopolymers are still front and centre in our quest to understand molecular biology, small molecules are crucial for our quest to interact with the inventory of the cell, create useful products, or advance medicine.
A number of public repositories make small-molecule information available, such as PubChem at the NCBI, the ligand collection at the PDB, the ChEBI database at the European Bioinformatics Institute, or the NCI database browser at the US National Cancer Institute. One general way to export topology information from these services is to use SMILES strings—a shorthand notation for the composition and topology of chemical compounds.
Task:
- Access PubChem.
- Enter "caffeine" as a search term in the Compound tab. A number of matches to this keyword search are returned.
- Click on the top hit - the Caffeine molecule. Note that the page contains among other items:
- A 2D structural sketch;
- An idealized 3D structural conformer, for which you can download coordinates in several formats;
- The IUPAC name:
1,3,7-trimethylpurine-2,6-dione; - The CAS identifier
58-08-2which is a unique identifier and can be used as a cross-reference ID; - The SMILES strings
CN1C=NC2=C1C(=O)N(C(=O)N2C)C; - ... and much more.
That's great, but let's sketch our own version of caffeine. Several versions of Peter Ertl's Java Molecular Editor (JME) are offered online, PubChem offers this functionality via its Sketcher tool.
Task:
- Return to the PubChem homepage.
- Follow the link to Structure search (in the right hand menu).
- Click on the 3D conformer tab and on the Launch button to launch the molecular editor in its own window.
- Sketch the structure of caffeine. I find the editor quite intuitive but clicking on the Help button will give you a quick, structured overview. Make sure you define your double-bonds correctly.
- Export the SMILES string of your compound to your project folder.
Translating SMILES to structure
Chimera can translate SMILES strings to coordinates[1].
Task:
- Open Chimera.
- Select Tools → Structure Editing → Build Structure.
- In the Build Structure window, select the SMILES string button, paste the string from your file, and click Apply.
- The caffeine molecule will be generated and visualized in the graphics window. This is a "stick" representation.
- You can rotate it with your mouse, <command> drag to scale, <shift> drag to translate.
- Use the Actions → Atoms/Bonds → ball & stick or sphere menu items to change appearance.
- Use the Actions → Color → by element menu to change colors.
- Change the display back to stick and use Actions → Surface → show to add a solvent accessible surface. It is a bit rough for this small molecule...
- Select the surface with <control><click> (<control><left mouse button> on windows). A green contour line appears around selected items.
- Open the selection inspector by clicking on the tiny green icon in the lower-right corner of the window (It has a magnifying glass symbol which means "inspect" for Chimera, not "search").
- Select Inspect ...MSMS surface and change the Vertex density value to 50.0 - hit return.
- Use the Actions → Color → all options menu to change colors: use the surfaces button to apply a color choice to the surface and choose cornflower blue.
- Use the Actions → Surface → transparency → 50% menu to see bonds contained in the surface.
- To begin working with molecules in "true" 3D, choose Tools → Viewing Controls → Camera and select camera mode → wall-eye stereo. Also, use the Effects tab of the Viewing window, and check shadows off.
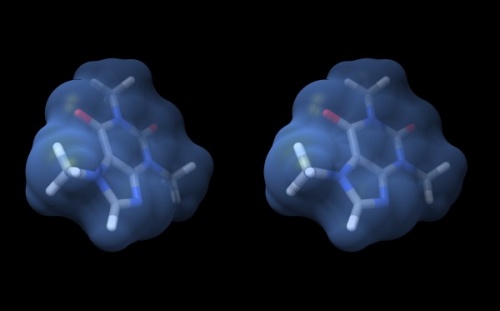
- Your structure should look about like what you see below. Save your session with the File → Save Session dialogue so you can easily recreate the scene.
Wall-eye stereo view of the caffeine structure, surrounded by a transparent molecular surface. The image for the left eye is on the left side. For instructions on stereo-viewing, see the next section.
Stereo vision
A simple molecular scene like the caffeine molecule is a great way to practice viewing structures in stereo. This is a learnable skill, but it takes practice.
Task:
Access the Stereo Vision tutorial and practice viewing molecular structures in stereo.
Practice at least ...
- two times daily,
- for 3-5 minutes each session,
Keep up your practice throughout the course. It is a wonderful skill that will greatly support your understanding of structural molecular biology. Practice with different molecules and try out different colours and renderings.
Note: do not go through your practice sessions mechanically. If you are not making any progress with stereo vision, contact me so we can help you on the right track.
Global properties
In this series of tasks we will showcase some of the globally applied tools that help us study molecular structure.
A Ramachandran plot
Task:
- To reset all views and selections, choose Favorites → Model Panel. Select the 1BM8 model and click the close button to remove it.
- In the graphics window, click on the "lightning bolt" icon at the bottom. You should see a button labelled 1BM8 on the right. This is where you will find recent structures. Click
1BM8to re-load it. - Choose Presets → Interactive 2 (all atoms) for a detailed view.
- Choose Favorites → Model Panel
- Look for the Option Ramachandran plot... in the choices on the right.
- Click the button and study the result. The dots in thisRamachandran Plot represent the phi-psi angle combinations for residue backbones. We see that they are well distributed, this is a high-resolution structure essentially without outliers. Clicking on a dot selects a residue in the structure viewer (selected residues have a green contour).
- Choose File → Fetch by ID and fetch
1L3G, an NMR structure of the Mbp1 APSES domain. Chimera loads the 19 models that comprise this structure dataset. - In the Favorites → Model Panel, select 1BM8 and click on hide.
- Then select 1LG3 and click group/ungroup to be able to address the models individually. Select any of the models individually and click again on Ramachandran plot. You will see that the points are much more dispersed, and there are a number of outliers that have comparatively high-energy conformations.
B-factors
Task:
- Choose Favorites → Model Panel, click/drag over the 1LG3 models and click close to remove them again.
- To explore B-Factors in the 1BM8 model, click show to view it again.
- Choose Tools → Structure Analysis → Render byAttribute.
- Select Attributes of atoms, Model 1BM8 and Attribute: bfactor. A histogram appears with sliders that allow you to render the distribution of values found in the structure for this attribute.
- Let's colour the atoms by B-Factor. Click on the colours tab. A standard colouring scheme is blue - white - red, but you can move the sliders, add new thresholds, and colour them individually by clicking on the colour patch to create your own colour spectrum, e.g. from black via red to white, in a black-body spectrum. Click Apply.
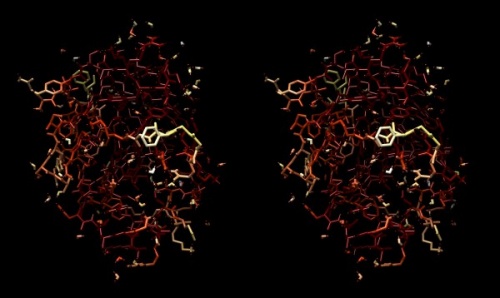
- Choose Actions → Atoms/Bonds → stick to give the bonds more volume. You will find that the core of the protein has low temperature factors, and the surface has a number of highly mobile sidechains and loops.
Structure of the yeast transcription factor Mbp1 DNA binding domain (1BM8) coloured by B-factor (thermal factor). The protein bonds are shown in a "stick" model, coloured with a spectrum that emulates black-body radiation. Note that the interior of the protein is less mobile, some of the surface loops are highly mobile (or statically disordered, X-ray structures can't distinguish that) and the discretely bound water molecules that are visible in this high-resolution structure are generally more mobile than the residues they bind to.
Electrostatics
Task:
- To visualize the electrostatic potential of the protein, mapped on the surface, first select Presets → Interactive 2... and Actions → Color → cyan for a vividly contrasting color.
- A simple electrostatic potential calculation just assumes Coulomb charges. A more accurate calculation of full Poisson-Boltzmann potentials is also available. Select Tools → Electrostatic/Binding Analysis → Coulombic Surface Coloring.
- Make sure the surface object is selected in the form (it should be selected by default since there is only one surface), keep the default parameters and click Apply.
- Use Actions → Surface → Transparency → 30% to make the protein backbone somewhat visible.
- Open the Tools → Viewing Controls → Lighting window → and set Intensity from two-point to ambient. This reduces shadowing and reflections on the surface and thus emphasizes the color values - here our focus is not on shape, but on property.
- Use the Effects tab to turn shadows off and depth-cueing and silhouettes on. This recreates visual cues of depth which compensate for the loss of shape information by using a flat lighting model.
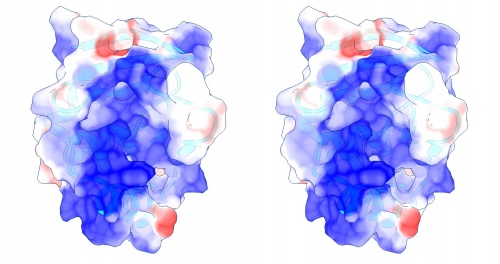
Coulomb (electrostatic) potential mapped to the solvent accessible surface of the yeast transcription factor Mbp1 DNA binding domain (1BM8). The protein backbone is visible through the transparent surface as a cartoon model, note the helix at the bottom of the structure. This helix has been suggested to play a role in forming the domain's DNA binding site and the positive (blue) electrostatic potential of the region is consistent with binding the negatively charged phosphate backbone of DNA. The other side of the domain has a negative (red) charge excess, which balances the molecule's electric charge overall, but also guides the protein-ligand interaction and supports faster on-rates.
Hydrogen bonds
Task:
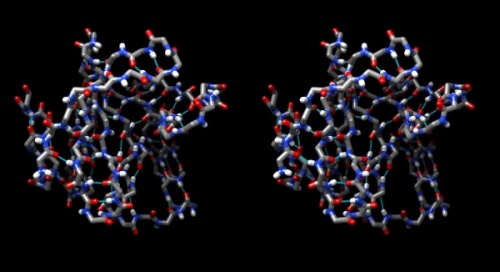
- Hydrogen bonds encode the basic folding patterns of the protein. To visualize H-bonds select Presets → Publication 1... and Actions → Color → by element.
- Use Tools → Structure Analysis → FindHBond and Apply default parameters.
- To emphasize the role of H-bonds in determining the architecture of the protein, select Select → Structure → backbone → full and then Select → Invert (all models). Now Actions → Atoms/bonds → hide will show only the backbone with its H-bonds.
Chimera sequence interface
In this task we will explore the sequence interface of Chimera, use it to select specific parts of a molecule, and colour specific regions (or residues) of a molecule separately.
Task:
- Display the protein in Presets → Interactive 1 mode and familiarize yourself with its topology of helices and strands.
- Now turn hydrogen bonds off: the menu commands of Chimera all have a command line equivalent. Open the command line by clicking on the "computer" icon in the upper left corner of the viewer window. Then type "~hbonds". The "~" undoes previous commands.
- Use Tools → Depiction → Rainbow to color the chain from blue to red. (You need to change the colour patches by clicking on them to open the colour editor. Choose an HSL colour model, use Saturation and Lightness 0.5 to keep the colour to somewhat subdued hues, then use the slider to choose appropriate hue values.) Click Apply.
- Open the sequence tool: Tools → Sequence → Sequence. By default, coloured rectangles overlay the secondary structure elements of the sequence.
- Hover the mouse over some residues and note that the sequence number and chain is shown at the bottom of the window.
- Click/drag one residue to select it. (Simply a click wont work, you need to drag a little bit for the selection to catch on.) Note that the residue gets a green overlay in the sequence window, and it also gets selected with a green border in the graphics window.
- In the bottom of the sequence window, there are instructions how to select (multiple) regions. Clear the selection by <control> clicking into an empty spot of the viewer. Now select the region that encompasses the residues that have been reported to form the DNA binding subdomain:
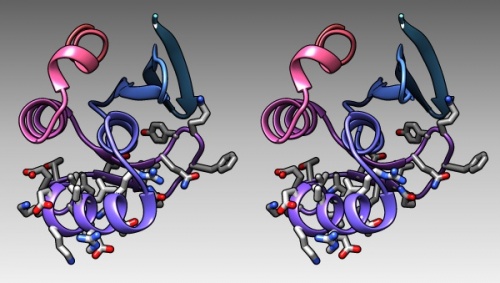
KRTRILEKEVLKETHEKVQGGFGKYQ(Taylor 2000). Show the side chains of these residues by clicking on the little green inspector icon on the viewer window, inspecting Atom and choosing displayed: true, and inspecting Bond and setting the stick radius to 0.4. - Undisplay the Hydrogen atoms by selecting the element H in the Chemistry option of the Selection Menu, and use the Action menu to hide them. Then use the effects pane of the Depiction menu to add a contour.
- Finally, give the scene a gradient grey background grey via the Actions → Color → all options... menu.
Links and resources
- Molecular Graphics Software Links– a collection of links at the PDB.
| Taylor et al. (2000) Characterization of the DNA-binding domains from the yeast cell-cycle transcription factors Mbp1 and Swi4. Biochemistry 39:3943-54. (pmid: 10747782) |
Footnotes and references
- ↑ There are several online servers that translate SMILES strings to idealized structures, see e.g. the online SMILES translation service at the NCI.
Ask, if things don't work for you!
- If anything about the assignment is not clear to you, please ask on the mailing list. You can be certain that others will have had similar problems. Success comes from joining the conversation.
- Do consider how to ask your questions so that a meaningful answer is possible:
- How to create a Minimal, Complete, and Verifiable example on stackoverflow and ...
- How to make a great R reproducible example are required reading.
| < Assignment 4 | Assignment 6 > |
