Structure data
Structure data
Objectives
- Understand that "sequence" and "structure" are abstractions of biopolymers.
- Understand that "structure" is an idealized concept, applied to an ensemble of dynamic molecules.
- Be aware of principal methods of experimental structure determination and some of their limitations regarding interpretation of data and resulting accuracy.
- Understand that structures may have considerable local and global uncertainties.
- Know that structure abstractions can be stored, retrieved and visualized and become familiar with the principal databases and information sources for that purpose.
- Be familiar with the contents of a PDB formatted file.
Links
- Bernhard Rupp's introduction to crystal structure
- The phase problem (of crystallography)
- Nuclear Overhauser Effect
- Whatcheck
- Procheck
- The PDB
- The PQS service
- The Nucleic Acid Structure Database
- PDBsum
- the HIC-Up database of hetero compounds in PDB files
- th JME molecular editor
- CORINA 3D-structure generator
- VMD
Slides
The "structure" abstraction
Slide 0008
Slide 0009
Slide 0010
Experimental determination of structure
Slide 0012
Slide 0013
Slide 0014
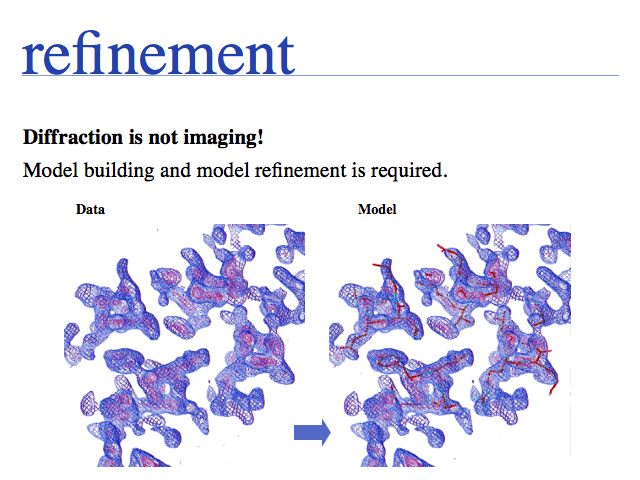
See: Bernhard Rupp's introduction to crystal structure.
Slide 0015
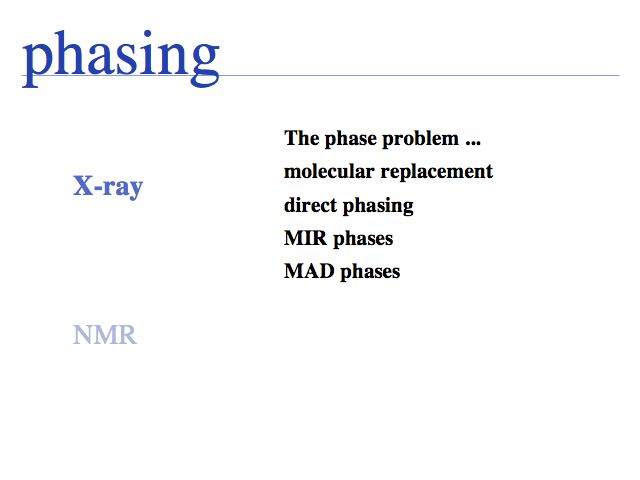
The phase problem (of crystallography)
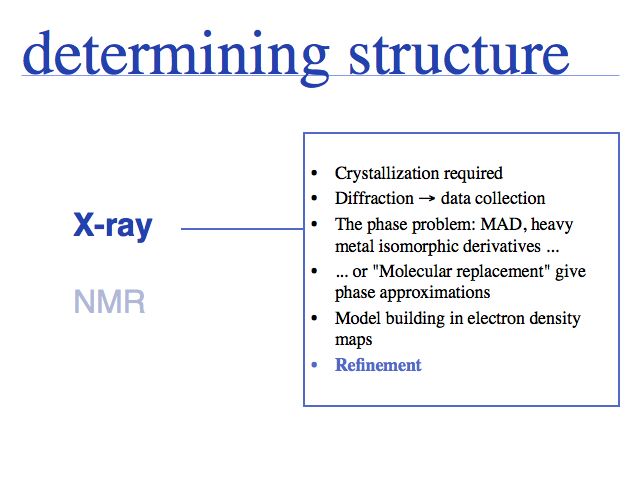
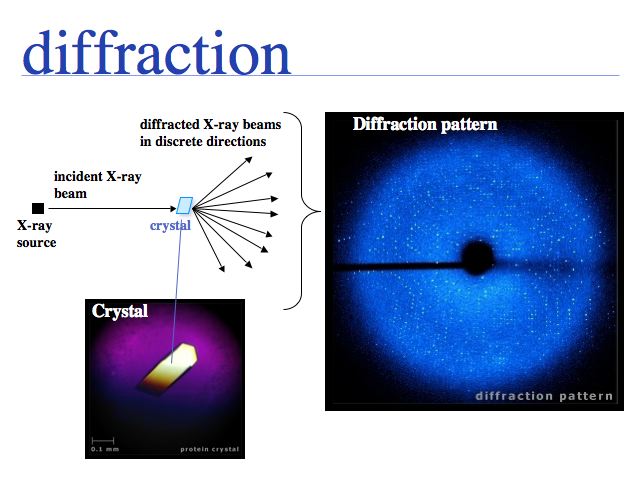
The inability to measure the phases of diffracted photons prevents the reconstruction of the diffracting objects from on set of experimental measurements alone. Additional information must be sought, based on the fact that photons that are in phase enhance the measured intensities, whereas photons that are phase-shifted by 180° cancel each other's intensities. Thus measuring intensity changes caused by additional diffraction centres that are placed into the crystall lattice, allows us to infer relative phases. If several relative phases are known, we can triangulate their absolute values. Experimental error makes this a difficult problem, but under favourable circumstances the electron density map will be interpretable; a structural model can then be built and refined.
Slide 0016
Slide 0017
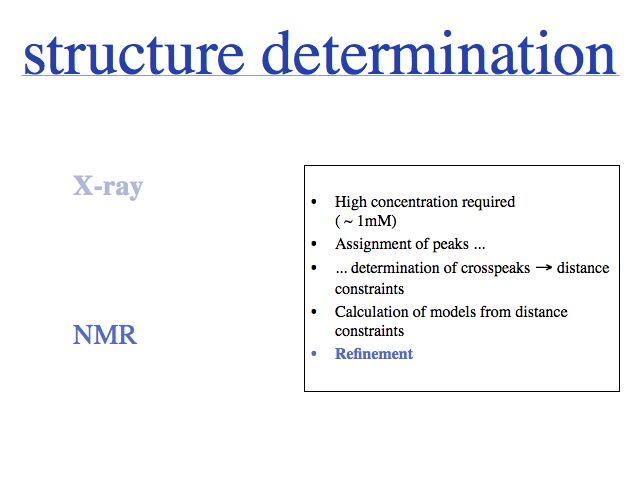
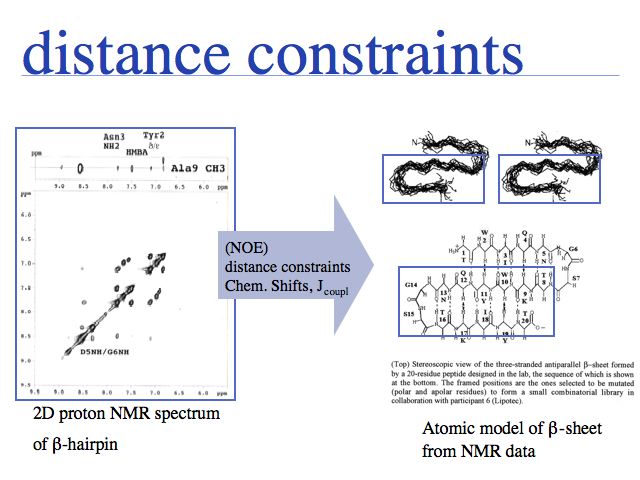
Which precessing proton resonates with a particular frequency can be determined ("peak assignment"). When the proton is excited at this frequency, its spin-polarization can be transferred through space with the so-called Nuclear Overhauser Effect. This effect is highly sensitive to spatial separation, therefore it can generate a list of distance constraints between specific protons.
Slide 0018
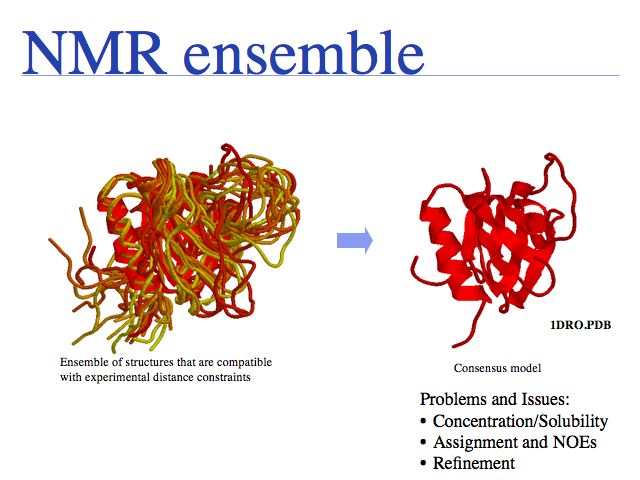
Distance constraints are translated into "pseudo energies" that are used in molecular dynamics simulations to generate structural models. The simulation starts from a random conformation and then runs until the energy of the model is minimzed. Violations of stereochemistry (bond-lengths, angles and steric clashes) are minimized together with violations of experimental distance constraints. This typically generates an ensemble of conformational models which is then averaged and further refined to finally arrive at a final consensus model.
Slide 0019
Slide 0020
Slide 0021
Structure database contents
Slide 0023
Slide 0024
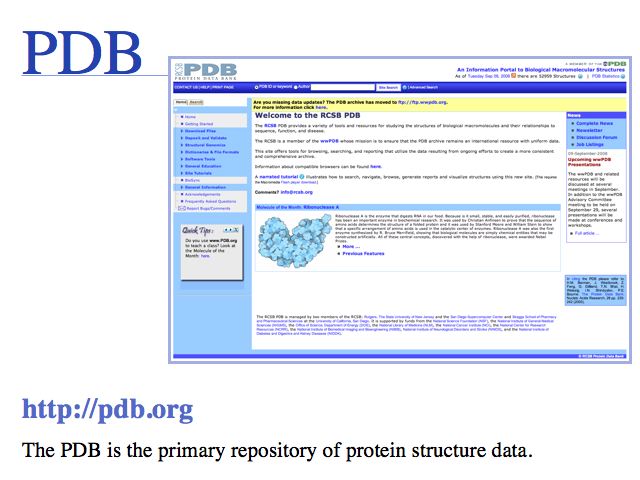
The PDB
Slide 0025
Slide 0026
Slide 0027
Slide 0028
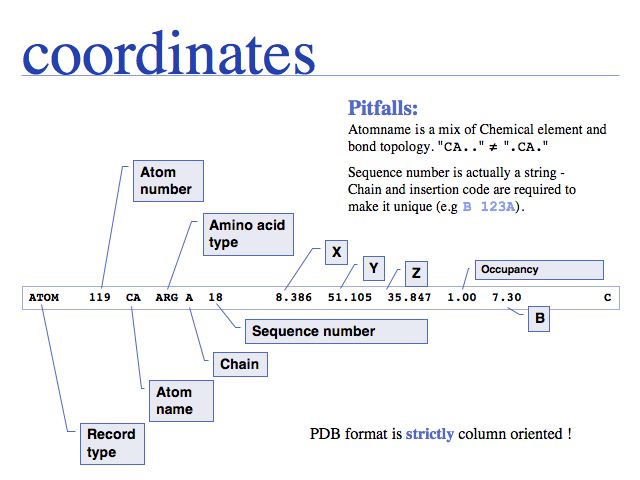
Additional complications arise from "insertion codes". These are letters that allow the insertion of residues for a common numbering scheme for families of homologous sequences. In principle this is a good idea, since this makes comparison of residues much easier. But strings such as "23A" can no longer be tretaed as "sequence numbers - thet are sequence labels and using them correctly can be a challenge.
Slide 0029
Potential pitfalls:
- Record type: changes not consistently applied for modifications
- Atom number: rarely used and a nuisance to update when changing.
- Atom name: careful about columns
- Amino acid type: careful about e.g. selenocysteine. Some very old files use TRY for TRP
- Chain: may be blank (" ") in older files. Recently was changed to ("A") even in files that contain only a single chain.
- Alternate location: only sometimes given in very high resolution structures.
- Sequence number
- X,Y, and Z are given in Å (10<sup-10 m = 0.1 nm) values in a cartesian (i.e. orthogonal) coordinate system; but origin and orientation is arbitrary!
- Occupancy can describe: special locations, partially bound ligands, unobserved fragments of structure
- B-values, (also called temperature factors) are a measure of the volume of space around into which a
Read the Coordinate section of the PDB format specification (V 2.3)
Slide 0030
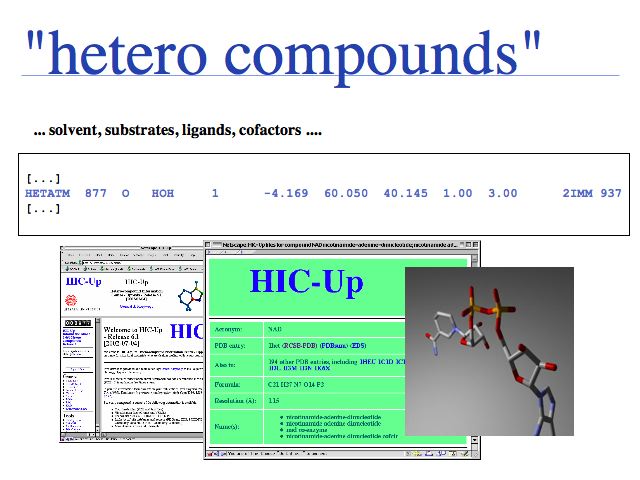
See the HIC-Up database of hetero compounds in PDB files.
Slide 0031
Slide 0032
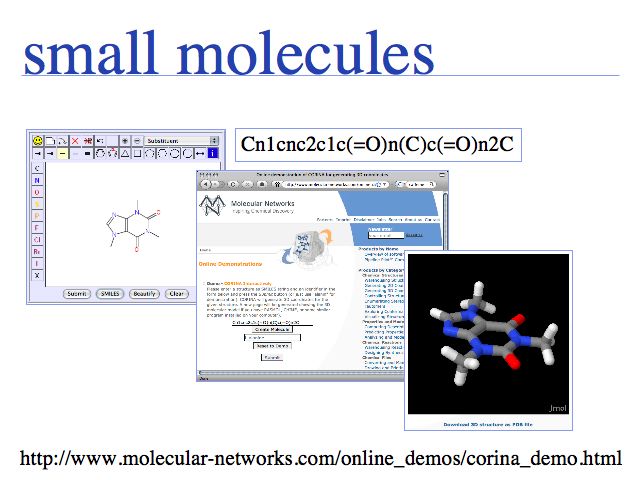
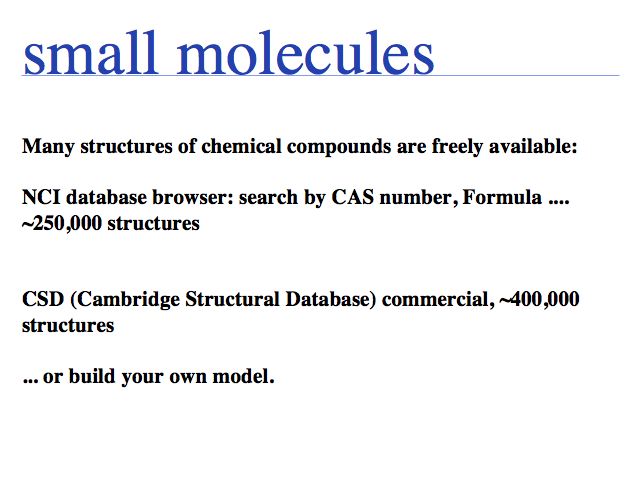
Creating small molecule structures from scratch with th JME molecular editor and the CORINA 3D-structure generator.
ACD chemsketch is a windows-only alternative.
Slide 0033
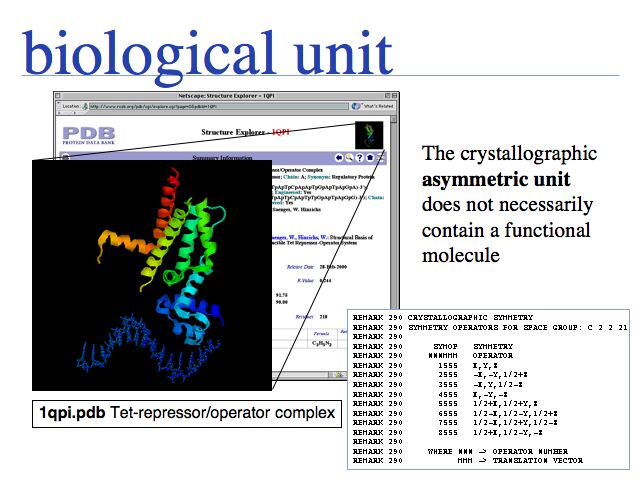
In the example above, only one chain of the tet-repressor dimer is seen bound to only one strand of B-DNA. The second chain and strand can be generated through a symmetry operation (180° rotation and translation), thus it contains the same coordinate information and does not need to be separately stored. However, in order to study the functional molecule, the redundant coordinates have to be combined to a homodimer. The term biological unit describes a coordinate set that (presumably) depicts a homooligomer in its functional state. All molecules in the crystal lattice can be generated from the crystallographic symmetry operations specified in a PDB file, for the space group of the crystal. But it may not be obvious which of the symmetry replicates might actually be involved in a physiological interaction and which ones have only been induced by the crystallization process. In the tet-repressor example, the crystallographic space group has eight symmetry related monomers in the unit cell of the crystal lattice.
Slide 0034
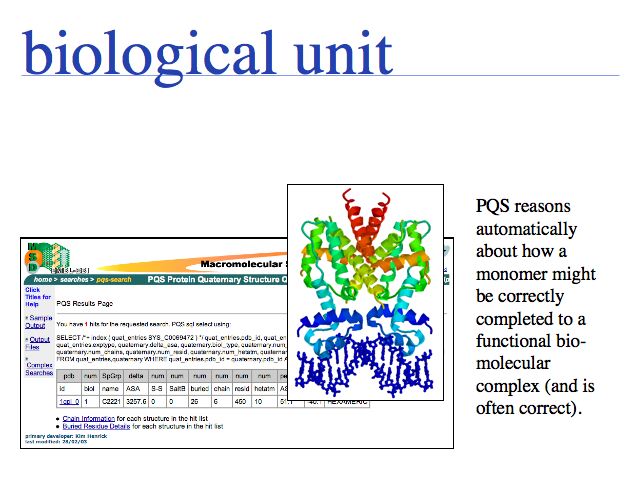
The PQS service for Probable Quarternary Structures at the EBI.
Many biological unit structures are also made available directly from the structure summary page of the PDB Website.
Slide 0035
Slide 0036
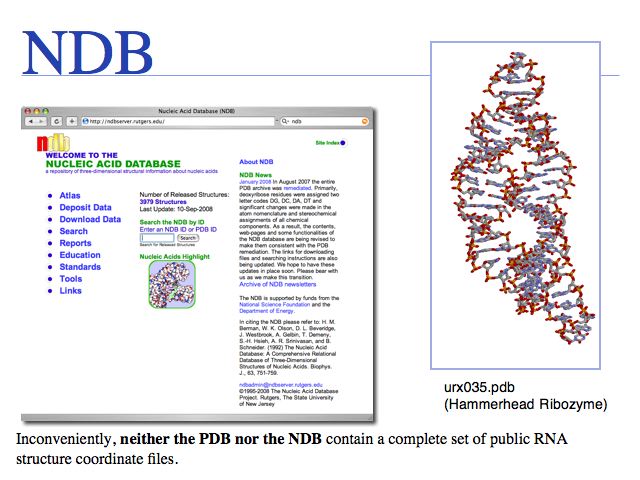
The Nucleic Acid Structure Database
Slide 0037
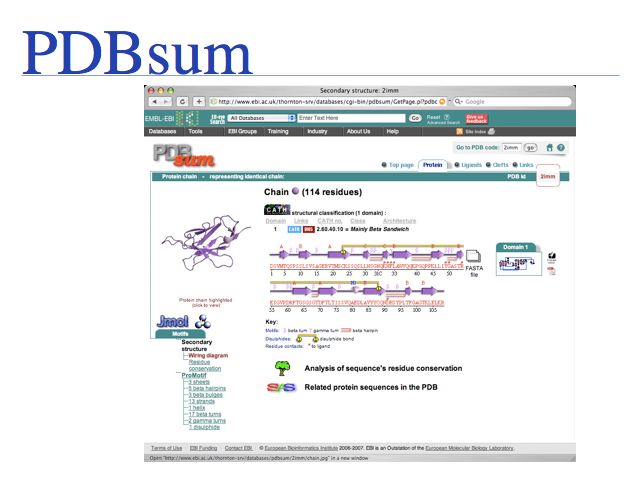
PDBsum is a secondary database thst stores analysis and interpretation information for PDB coordinate sets.
Slide 0038
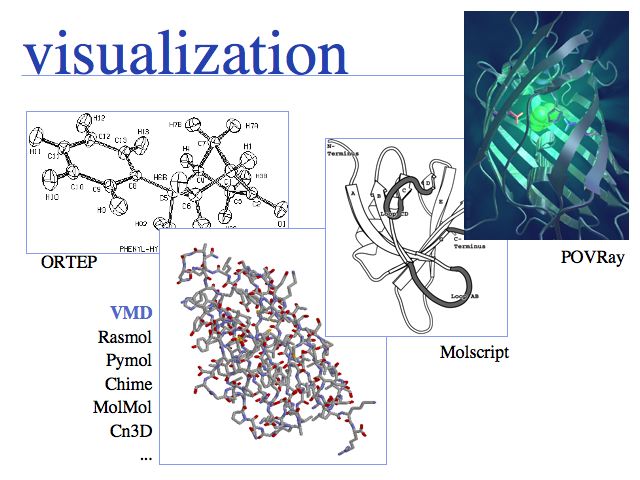
Slide 0039
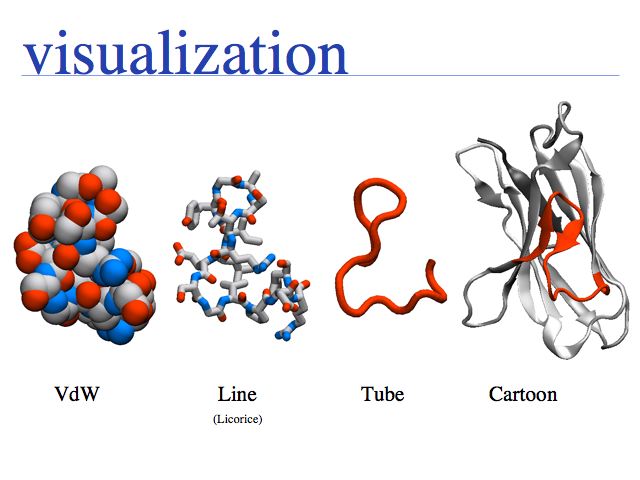
Various tools exist for different visualization tasks. ORTEP was one of the earliest programs and plots thermal ellipsoids with three degrees of freedom. Most protein structures do not have this data available but many small molecule structures do. There is a host of 3D, interactive molecular visualization programs available, in this course we use VMD. Examples of programs that draw moleculer scenes for publications include Molscript, or the generic ray-tracing program POVray. VMD can generate povray input files, such as the one from which I generated this internally illuminated view of Green Fluorescent Protein (GFP).
