Lecture 10
Jump to navigation
Jump to search


(Previous lecture) ... (Next lecture)
Interpreting Protein Structure
Objectives for this part of the course
- Understand that PDB files contain coordinate information, measured in an orthogonal coordinate system in Å (0.1 nm, 10-10m ).
- Have a sense of the approximate sizes of biological objects.
- Be familiar with the most frequently recurring conformations in protein structure.
- Be aware that these recurring units are just labels and there is some degree of arbitrariness involved in assigning them to real coordinates.
- Understand that more frequently observed conformations are more favourable - for function, for stability or both.
- Be able to superimpose two structures and compare their differences.
- Be able to find structures that are similar to a query.
Links summary
- Backbone Dependent Rotamer Library
- Atlas of Hydrogen Bonds
- Structural Alignment (Wikipedia)
- VAST at the NCBI
- DALI fold classification in Helsinki
- HOMSTRAD at the University of Cambridge
- List of Structural Alignment Software (Wikipedia)
Lecture slides
Analysis of coordinate geometry
Slide 006

Lecture 10, Slide 006
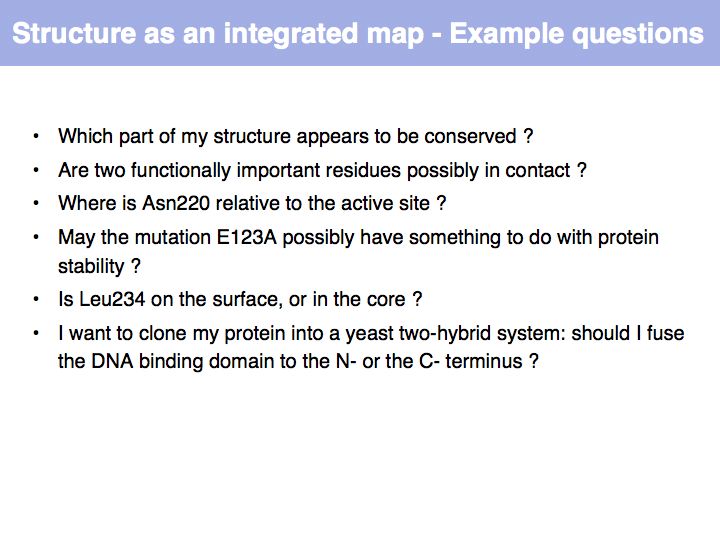
It is useful to view structures as a spatially integrated map of annotations. Spatial relationships provide the context that allows mechnistic, molecular interpretations to observed functions and behaviour.
It is useful to view structures as a spatially integrated map of annotations. Spatial relationships provide the context that allows mechnistic, molecular interpretations to observed functions and behaviour.
Slide 007

Lecture 10, Slide 007
Slide 008

Lecture 10, Slide 008
In this example: calculate the distance between the phenolic oxygen and a backbone carbonyl in a protein structure.
In this example: calculate the distance between the phenolic oxygen and a backbone carbonyl in a protein structure.
Slide 009

Lecture 10, Slide 009
Slide 010

Lecture 10, Slide 010
Slide 011

Lecture 10, Slide 011
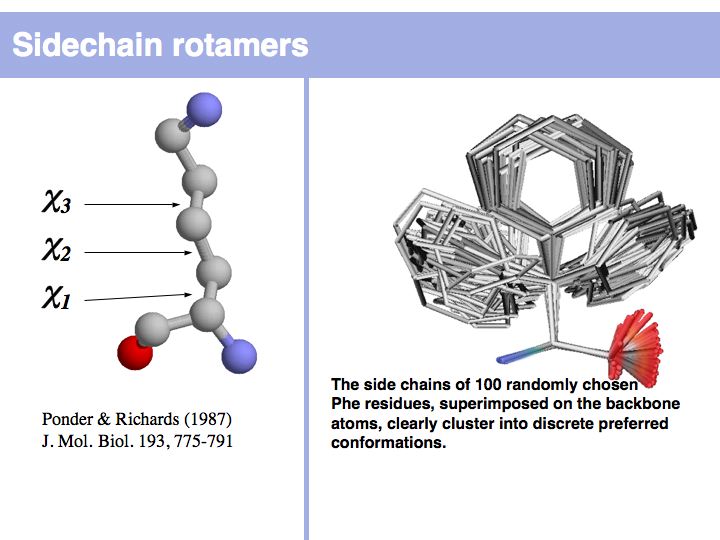
Rotamers are low-energy conformations of side-chain dihedral angles. Only a small number of rotamer states and combinations are significantly populated in natural proteins. This tremendously simplifies protein structure modelling and prediction problems. However it also guides analysis, e.g. in enzyme active sites the rotamers often exist in strained, rare conformations. See the Backbone Dependent Rotamer Library, compiled by Roland Dunbrack.
Rotamers are low-energy conformations of side-chain dihedral angles. Only a small number of rotamer states and combinations are significantly populated in natural proteins. This tremendously simplifies protein structure modelling and prediction problems. However it also guides analysis, e.g. in enzyme active sites the rotamers often exist in strained, rare conformations. See the Backbone Dependent Rotamer Library, compiled by Roland Dunbrack.
Slide 012

Lecture 10, Slide 012
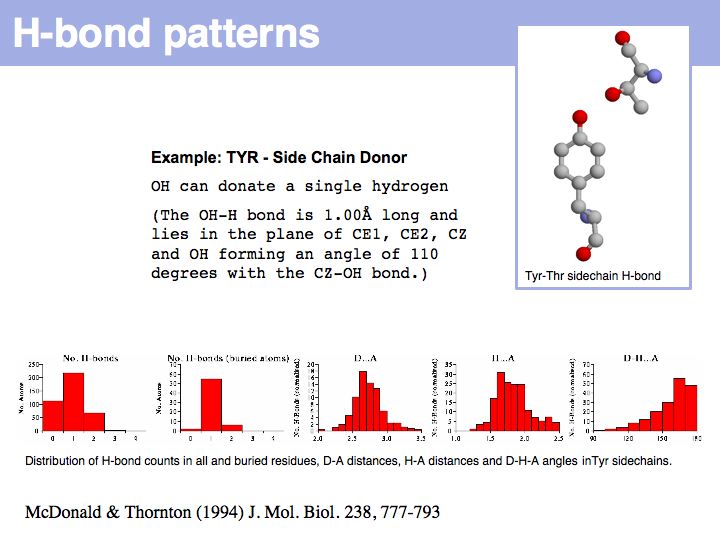
Hydrogen bonds have clear and well defined conformational preferences. The ideal donor-acceptor distance is betwen 2.7 and at most 3.5 Å, the angles between the non-hydrogen donor and acceptor atoms vary only to a small degree. One can view them as mechanisms to "lock-in" parts of protein structure. Cf. the Atlas of Hydrogen Bonds compiled by Ian McDonald and Janet Thornton.
Hydrogen bonds have clear and well defined conformational preferences. The ideal donor-acceptor distance is betwen 2.7 and at most 3.5 Å, the angles between the non-hydrogen donor and acceptor atoms vary only to a small degree. One can view them as mechanisms to "lock-in" parts of protein structure. Cf. the Atlas of Hydrogen Bonds compiled by Ian McDonald and Janet Thornton.
Slide 015
omitted
Slide 016

Lecture 10, Slide 016
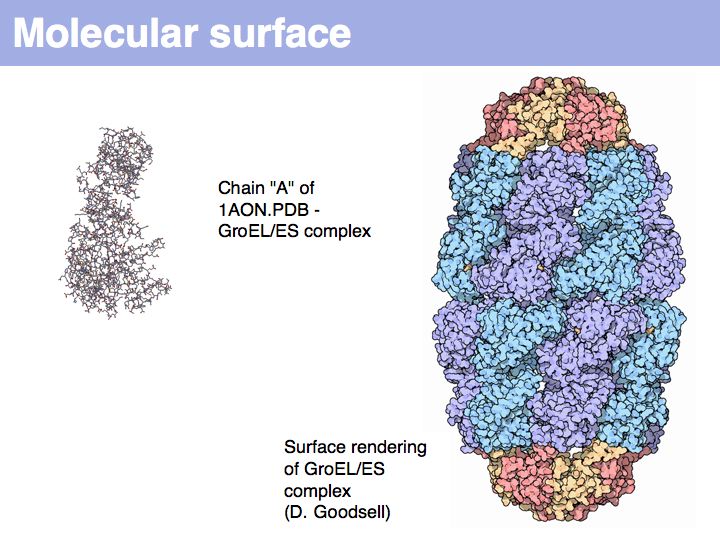
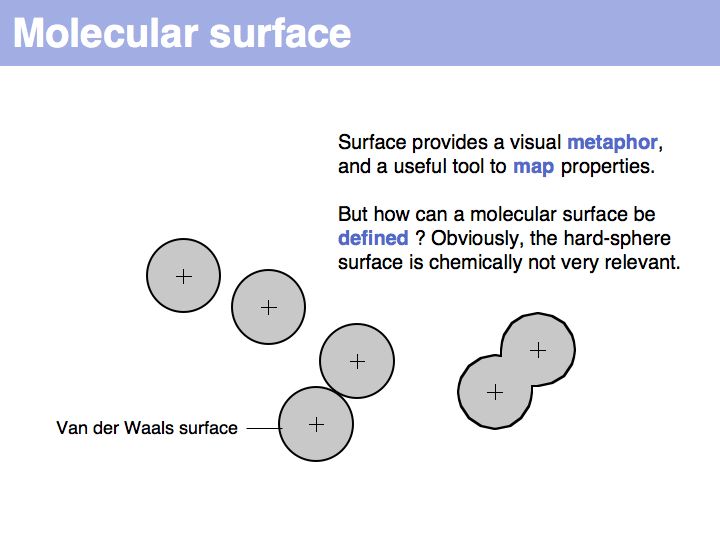
A set of coordinate points has no surface! Ascribing a surface to coordinates, in order to map coordinate sets to physical molecules, requires to consider the volume of space that is occupied by atoms, i.e. space, cannot be invaded by other molecules.
A set of coordinate points has no surface! Ascribing a surface to coordinates, in order to map coordinate sets to physical molecules, requires to consider the volume of space that is occupied by atoms, i.e. space, cannot be invaded by other molecules.
Slide 017

Lecture 10, Slide 017
Slide 018

Lecture 10, Slide 018
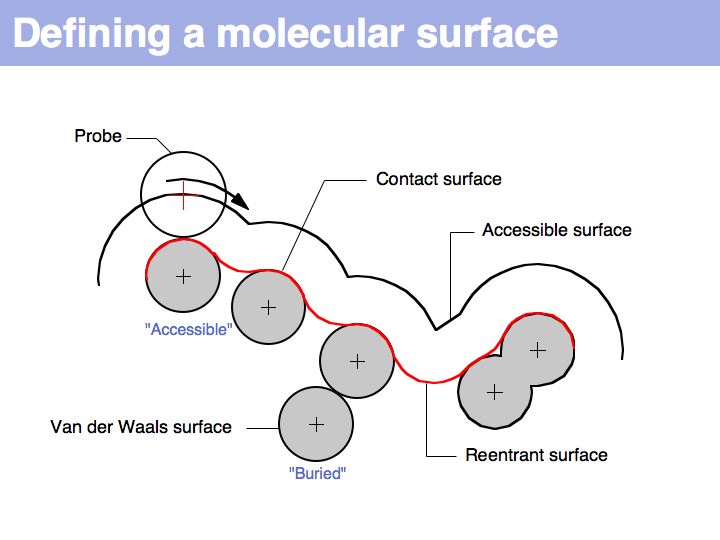
A molecular surface can be defined as the boundary that excludes a probe. Commonly, a probe of 1.4 Å radius is used - this is the spehrical approximation of a water molecule and thus this probe defiens a solvent accessible surface.
A molecular surface can be defined as the boundary that excludes a probe. Commonly, a probe of 1.4 Å radius is used - this is the spehrical approximation of a water molecule and thus this probe defiens a solvent accessible surface.
Slide 019

Lecture 10, Slide 019
The "Accessible Surface" depends on the probe radius.
The "Accessible Surface" depends on the probe radius.
Slide 020

Lecture 10, Slide 020
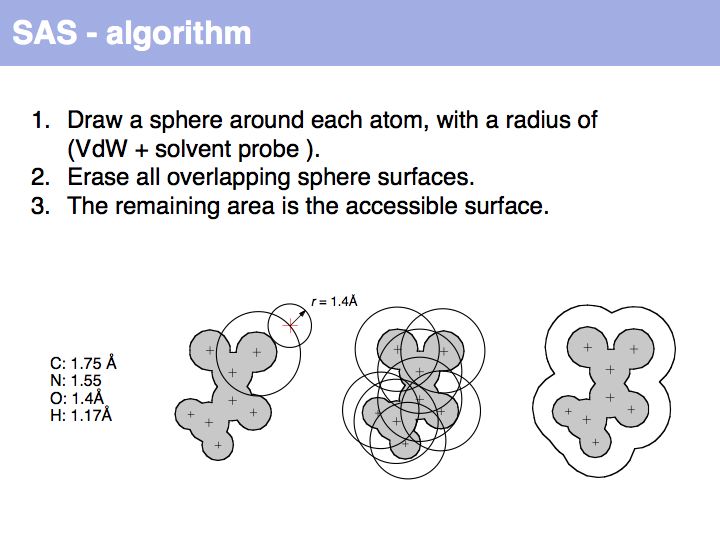
An easy way to calculate SAS (solvent accessible surface) areas is to (1) randomly place a given number of points on a sphere around an atom center, (2) erase points that are overlapped by neighboring atoms' spheres and (3) count the number of points that remain. The fraction of remaining points times the surface area of the original sphere approximates the solvent accessible surface area. Surface areas of individual residues are often expressed as relative values, i.e. the actual accessible surface area of a sidechain divided by the area of a maximally solvent-exposed sidechain. This characterizes the degree to which a sidechain is buried or accessible in a protein structure.
An easy way to calculate SAS (solvent accessible surface) areas is to (1) randomly place a given number of points on a sphere around an atom center, (2) erase points that are overlapped by neighboring atoms' spheres and (3) count the number of points that remain. The fraction of remaining points times the surface area of the original sphere approximates the solvent accessible surface area. Surface areas of individual residues are often expressed as relative values, i.e. the actual accessible surface area of a sidechain divided by the area of a maximally solvent-exposed sidechain. This characterizes the degree to which a sidechain is buried or accessible in a protein structure.
Slide 022

Lecture 10, Slide 022
Surfaces represent the parts of a protein that interact with the surroundings. In this example, the electrostatic potential mapping shows how an electrostatic potential gradient attracts the substrate molecule into Acetylcholine-esterase's active site.
Surfaces represent the parts of a protein that interact with the surroundings. In this example, the electrostatic potential mapping shows how an electrostatic potential gradient attracts the substrate molecule into Acetylcholine-esterase's active site.
Structure contains recurring units
Slide 024

Lecture 10, Slide 024
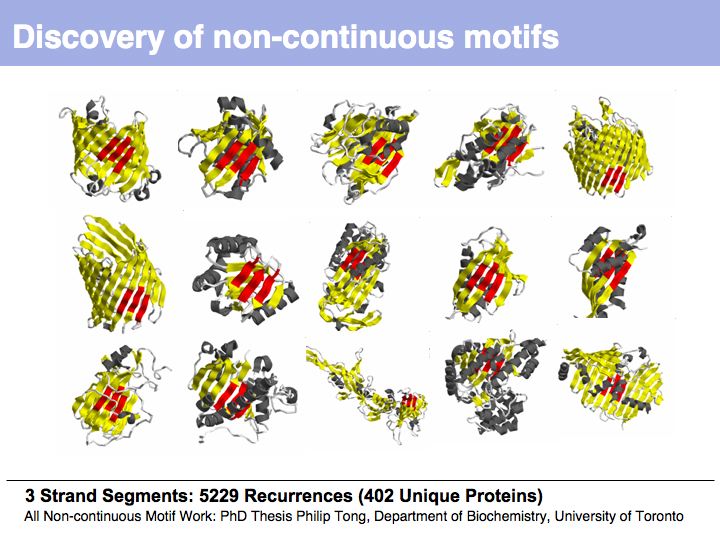
From the earliest protein structures, it was recognized that many of the local conformations of structure recur within and between proteins.
From the earliest protein structures, it was recognized that many of the local conformations of structure recur within and between proteins.
Slide 031

Lecture 10, Slide 031
Slide 032

Lecture 10, Slide 032
Slide 033

Lecture 10, Slide 033
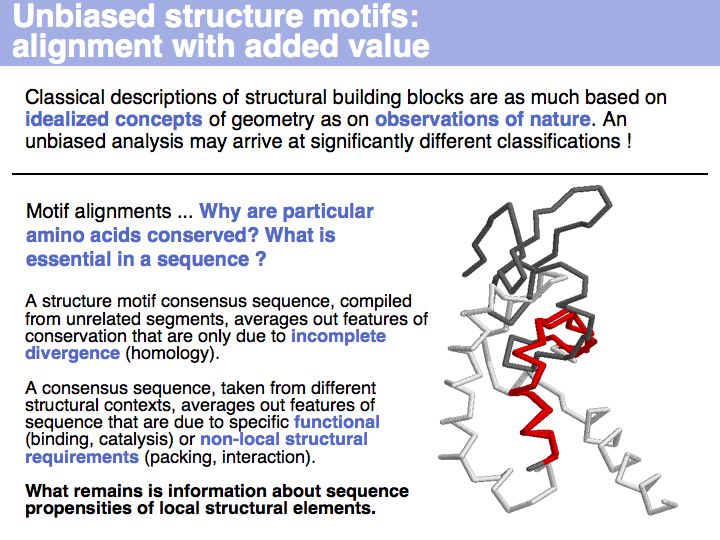
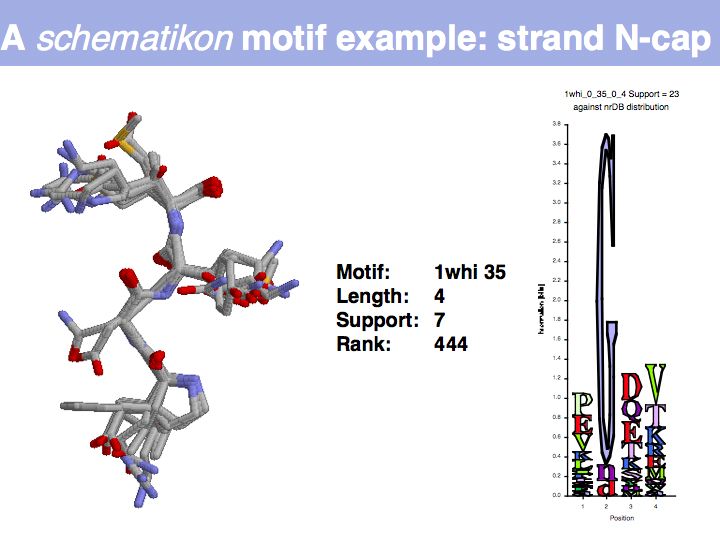
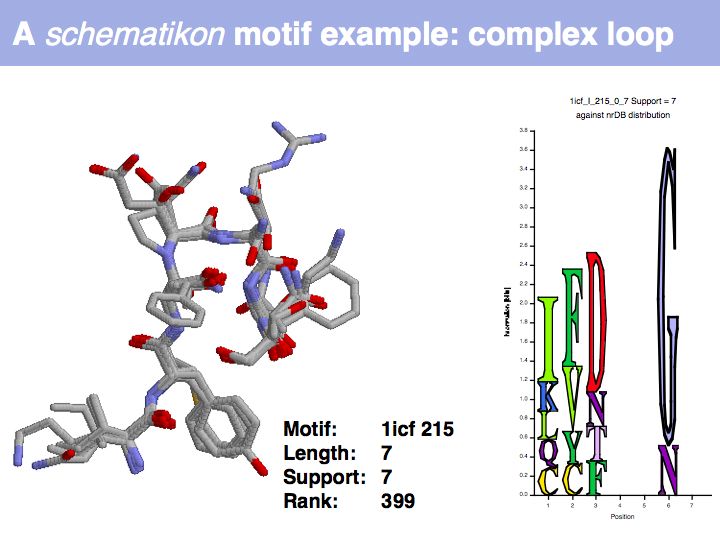
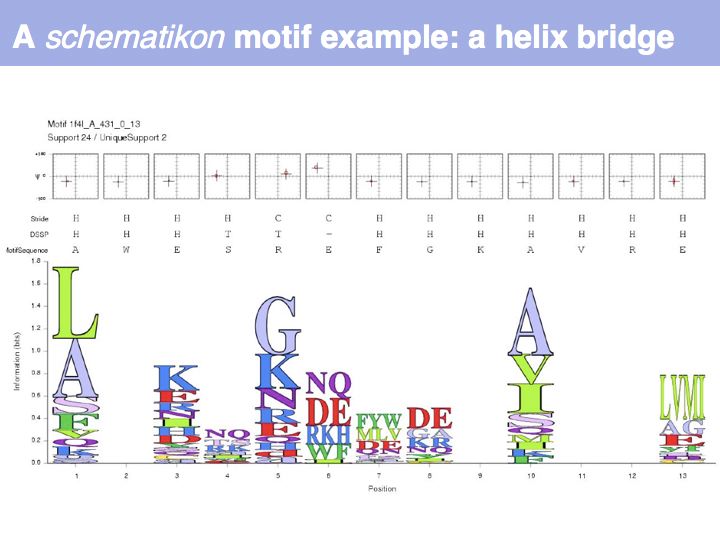
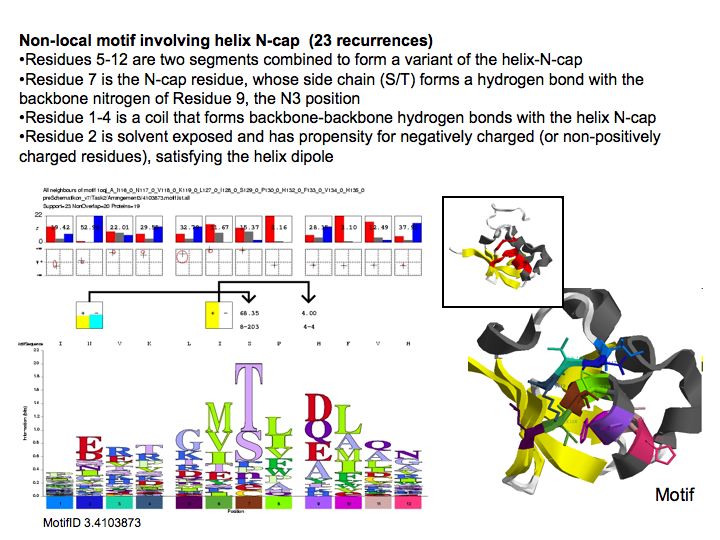
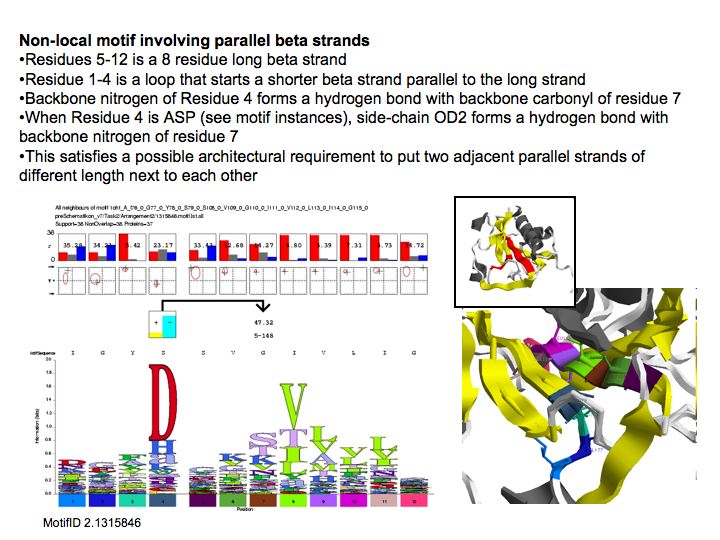
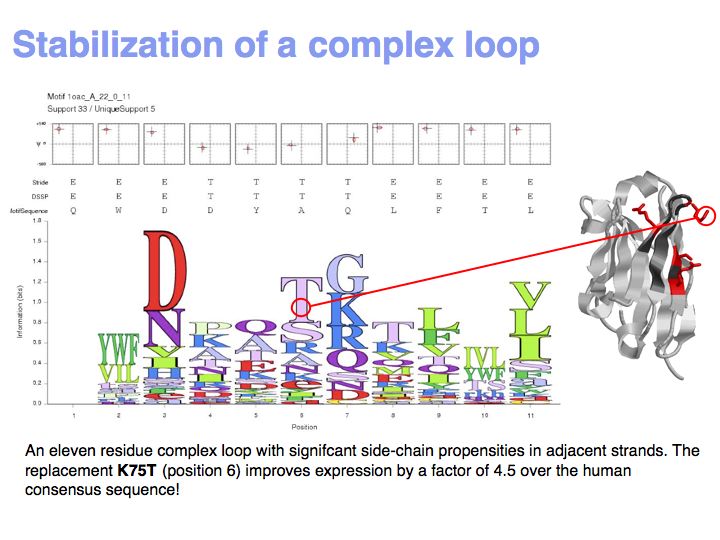
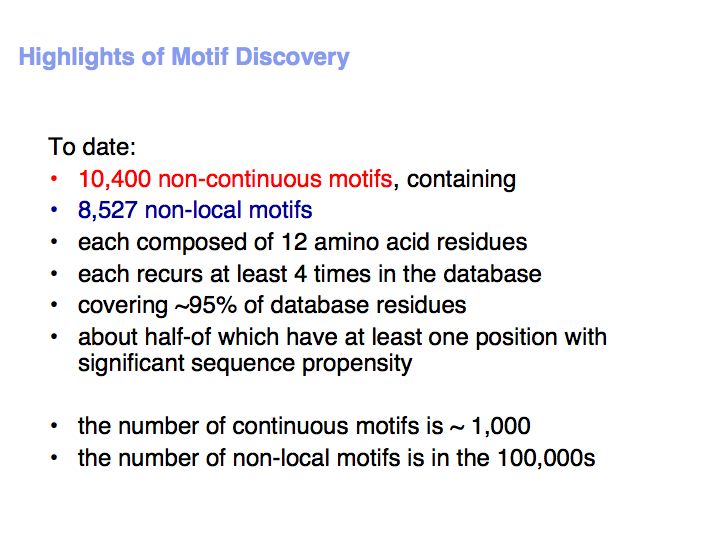
Motifs represent (presumably) low-energy patterns of conformations. They can be discovered in structure datasets by looking for patterns that recur more frequently than expected by random chance. In almost all cases, they have significant statistical propensities to favour particular amino acids in particular positions. This is an example from the schematikon dictionary of recurring structural motifs. he motif is a peptide of length four, recurring seven times. I is ranked in position 444 of all statistiacaly significant motifs. the overlap of backbone atoms is shown in the structural superposition, the propensity for individual amino acids is shown in the sequence logo. Note that the source data consists of non-hmologous protein structures, i.e. the sequence propensities do not represent conservation (since they are not related by common ancestry, but they represent examples of convergent evolution.
Motifs represent (presumably) low-energy patterns of conformations. They can be discovered in structure datasets by looking for patterns that recur more frequently than expected by random chance. In almost all cases, they have significant statistical propensities to favour particular amino acids in particular positions. This is an example from the schematikon dictionary of recurring structural motifs. he motif is a peptide of length four, recurring seven times. I is ranked in position 444 of all statistiacaly significant motifs. the overlap of backbone atoms is shown in the structural superposition, the propensity for individual amino acids is shown in the sequence logo. Note that the source data consists of non-hmologous protein structures, i.e. the sequence propensities do not represent conservation (since they are not related by common ancestry, but they represent examples of convergent evolution.
Slide 034

Lecture 10, Slide 034
Slide 035

Lecture 10, Slide 035
Slide 036

Lecture 10, Slide 036
Slide 037

Lecture 10, Slide 037
Slide 038

Lecture 10, Slide 038
Slide 039

Lecture 10, Slide 039
Slide 040

Lecture 10, Slide 040
Slide 041

Lecture 10, Slide 041
Propensity predicts stability
Slide 043

Lecture 10, Slide 043
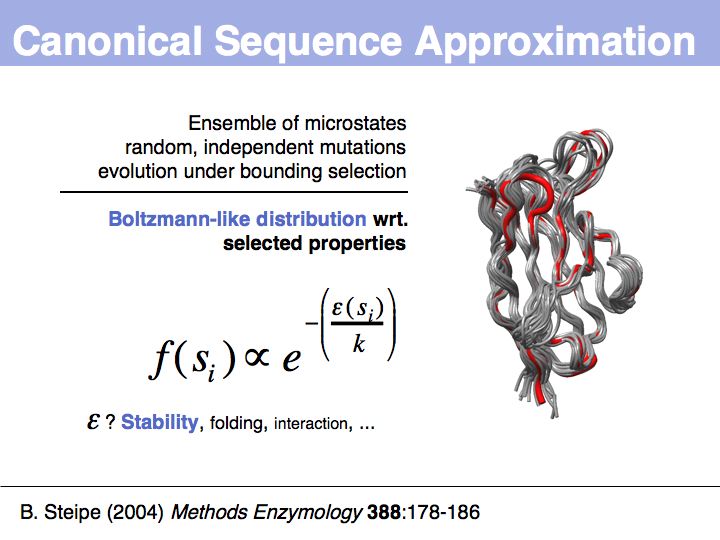
Mean field approach - context is constant: averaged context is an approximation to a constant context. What does Boltzmann-like distribution mean: there is a relationship between frequency of observed microstate
Mean field approach - context is constant: averaged context is an approximation to a constant context. What does Boltzmann-like distribution mean: there is a relationship between frequency of observed microstate
Slide 044

Lecture 10, Slide 044
Methods: RMSD and superposition
Slide 046

Lecture 10, Slide 046
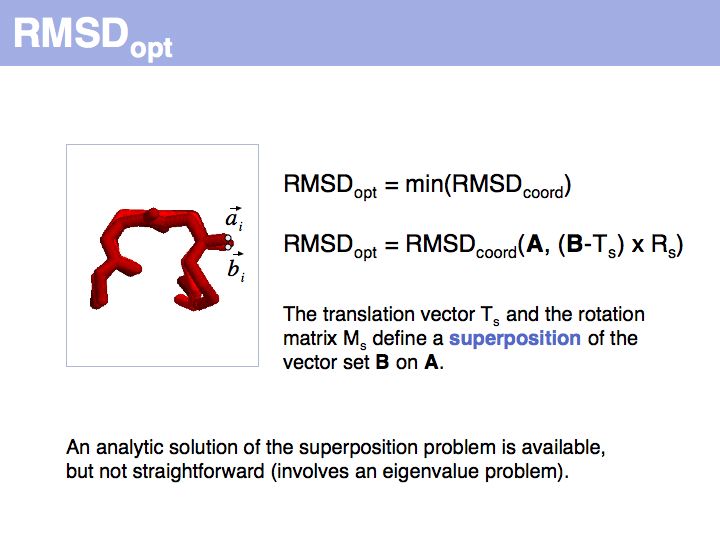
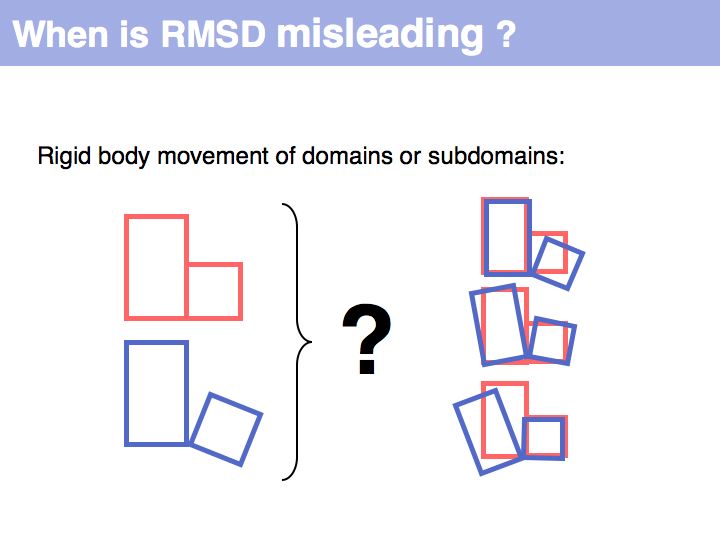
RMSD or root mean square deviation is simply the square root of the average sum of squared coordinate distances. However, this is just a measure of the relationship between two sets of points in space - it depends on the disynace between the point sets, their rotation and the quantitatiy we are interested in: their intrinsic structural similarity. See also: Structural Alignment (Wikipedia)
RMSD or root mean square deviation is simply the square root of the average sum of squared coordinate distances. However, this is just a measure of the relationship between two sets of points in space - it depends on the disynace between the point sets, their rotation and the quantitatiy we are interested in: their intrinsic structural similarity. See also: Structural Alignment (Wikipedia)
Slide 047

Lecture 10, Slide 047
A meaningful comparison of structural segments requires that the coordinate sets at first be optimally superimposed: this means find a translation and rotation that minimizes the remaining RMSD.
A meaningful comparison of structural segments requires that the coordinate sets at first be optimally superimposed: this means find a translation and rotation that minimizes the remaining RMSD.
Slide 048

Lecture 10, Slide 048
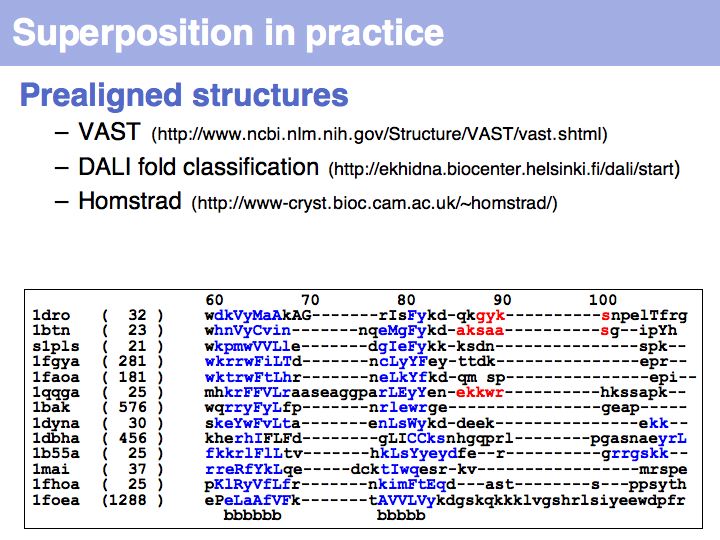
Several pre-superimposed structure sets are available on the Web: VAST at the NCBI DALI fold classification in Helsinki, HOMSTRAD at the University of Cambridge.
Several pre-superimposed structure sets are available on the Web: VAST at the NCBI DALI fold classification in Helsinki, HOMSTRAD at the University of Cambridge.
Slide 049

Lecture 10, Slide 049
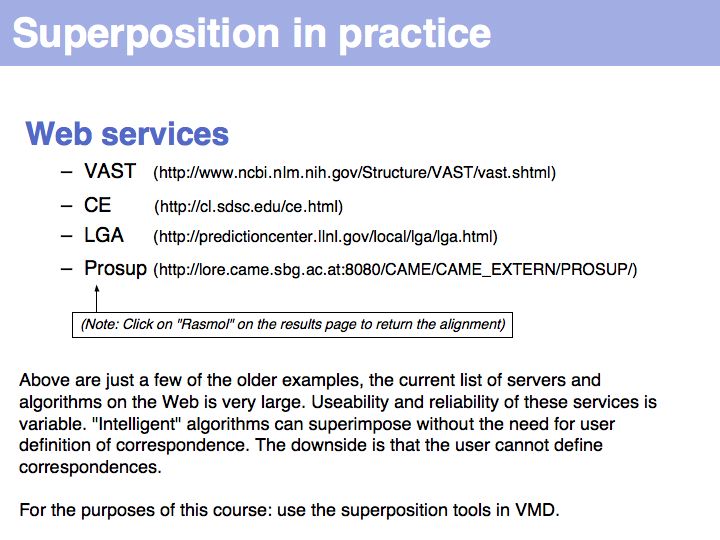
List of Structural Alignment Software (Wikipedia)
List of Structural Alignment Software (Wikipedia)
Slide 050

Lecture 10, Slide 050
Slide 052

Lecture 10, Slide 052
Structural knowledge - mechanistic explanations
Slide 068

Lecture 10, Slide 068