BIO Assignment Week 10
Assignment for Week 10
Expression Analysis
| < Assignment 9 | Assignment 11 > |
Note! This assignment is currently inactive. Major and minor unannounced changes may be made at any time.
Concepts and activities (and reading, if applicable) for this assignment will be topics on next week's quiz.
Contents
Introduction
The transcriptome is the set of a cell's mRNA molecules. The transcriptome originates from the genome, mostly, that is, and it results in the proteome, again: mostly. RNA that is transcribed from the genome is not yet fit for translation but must be processed: splicing is ubiquitous[1] and in addition RNA editing has been encountered in many species. Some authors therefore refer to the exome—the set of transcribed exons— to indicate the actual coding sequence.
Microarray technology — the quantitative, sequence-specific hybridization of labelled nucleotides in chip-format — was the first domain of "high-throughput biology". Today, it has largely been replaced by RNA-seq: quantification of transcribed mRNA by high-throughput sequencing and mapping reads to genes. Quantifying gene expression levels in a tissue-, development-, or response-specific way has yielded detailed insight into cellular function at the molecular level, with recent results of single-cell sequencing experiments adding a new level of precision. But not all transcripts are mapped to genes: we increasingly realize that the transcriptome is not merely a passive buffer of expressed information on its way to be translated into proteins, but contains multiple levels of complex, regulation through hybridization of small nuclear RNAs[2].
In this assignment, we will look at differential expression of Mbp1 and its target genes.
GEO2R
In this exercise we will use the analysis facilities of the GEO database at the NCBI.
Task:
- First, we will search for relevant data sets on GEO, the NCBI's database for expression data.
- Navigate to the entry page for GEO data sets].
- Enter the following query in the usual Entrez query format:
"cell cycle"[ti] AND "saccharomyces cerevisiae"[organism]. - You should get two datasets among the top hits that analyze wild-type yeast (W303a cells) across two cell-cycles after release from alpha-factor arrest. Choose the experiment with lower resolution (13 samples).
- On the linked GEO DataSet Browser page, follow the link to the Accession Viewer page: the "Reference series".
- Read about the experiment and samples, then follow the link to analyze with GEO2R
- View the GEO2R video tutorial on youtube.
- Now proceed to apply this to the yeast cell-cycle study
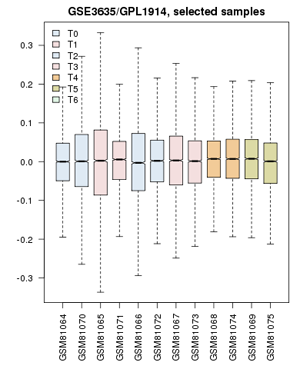 Value distribution for the yeast cell-cycle experiment GSE3635. Experiments are grouped approximately into equivalent time-points on a cell cycle.

- Define groups: the associated publication shows us that one cell-cycle takes pretty exactly 60 minutes. Create timepoints T0, T1, T2, ... T5. Then associate the 0 and 60 min. sample with "T0"; 10 and 70 minutes get grouped as "T1"; 20 and 80 minutes are T2, etc. up to T5. The final sample does not get assigned.
- Confirm that the Value distributions are unbiased by accessing the value distribution tab - overall, in such experiments, the bulk of the expression values should not change and thus means and quantiles of the expression levels should be about the same.
- Your distribution should look like the image on the right: properly grouped into six categories, and unbiased regarding absolute expression levels and trends.
- Look for differentially expressed genes: open the GEO2R tab and click on Top 250.
- Analyze the results.
- Examine the top hits. Click on a few of the gene names in the Gene.symbol column to view the expression profiles that tell you why the genes were found to be differentially expressed. What do you think? Is this what you would have expected for genes' responses to the cell-cycle? What seems to be the algorithm's notion of what "differentially expressed" means?
- Look for expected genes. Here are a few genes that are known to be differentially expressed in the cell-cycle as target genes of the MBF complex:
DSE1,DSE2,ERF3,HTA2,HTB2, andGAS3. But what about the MBD complex proteins themselves: Mbp1 and Swi6?
The notion of "differential expression" and "cell-cycle dependent expression" do not overlap completely. Significant differential expression is mathematically determined for genes that have low variance within groups and large differences between groups. This algorithm has no notion of any expectation you might have about the shape of the expression profile. All it finds are genes for which differential expression between some groups is statistically supported. The algorithm returns the top 250 of those. Consistency within groups is very important, while we intuitively might be giving more weight to conformance to our expectations of a cyclical pattern.
Let's see if we can group our time points differently to enhance the contrast between expression levels for cyclically expressed genes. Let's define only two groups: one set before and between the two cycles, one set at the peaks - and we'll omit some of the intermediate values.
- Remove all of your groups and define two groups only. Call them "A" and "B".
- Assign samples for T = 0 min, 10, 60 and 70 min. to the "A" group. Assign sets 30, 40, 90, and 100 to the "B" group.
- Recalculate the Top 250 differentially expressed genes (you might have to refresh the page to get the "Top 250" button back.) Which of the "known" MBF targets are now contained in the set? What about Mbp1 and Swi6?
- Finally: Let's compare the expression profiles for Mbp1, Swi6 and Swi4. It is not obvious that transcription factors are themselves under transcriptional control, as opposed to being expressed at a basal level and activated by phosporylation or ligand binding. In a new page, navigate to the Geo profiles page and enter
(Mbp1 OR Swi6 OR Swi4 OR Nrm1 OR Cln1 OR Clb6 OR Act1 OR Alg9) AND GSE3635(Nrm1, Cln1, and Clb6 are Mbp1 target genes. Act1 and Alg9 are beta-Actin and mannosyltransferase, these are often used as "housekeeping genes, i.e. genes with condition-independent expression levels, especially for qPCR studies - although Alg9 is also an Mbp1 target. We include them here as negative controls. CGSE3635 is the ID of the GEO data set we have just studied). You could have got similar results in the Profile graph tab of the GEO2R page. What do you find? What does this tell you? Would this information allow you to define groups that are even better suited for finding cyclically expressed genes? - Click on the profile graph for Mbp1 and print out the page. Write your name and student number on the page. With a red pen, in one sentence describe the evidence you find on that page that allows us to conclude whether or not Mbp1 is a cell-cycle gene. You'll probably want to think for a moment what this question really means, how a cell-cycle gene could be defined, and what can be considered "evidence", before you write. I will mark your response for a maximum of four marks.
Further reading and resources
| Okamura et al. (2015) COXPRESdb in 2015: coexpression database for animal species by DNA-microarray and RNAseq-based expression data with multiple quality assessment systems. Nucleic Acids Res 43:D82-6. (pmid: 25392420) |
|
[ PubMed ] [ DOI ] The COXPRESdb (http://coxpresdb.jp) provides gene coexpression relationships for animal species. Here, we report the updates of the database, mainly focusing on the following two points. For the first point, we added RNAseq-based gene coexpression data for three species (human, mouse and fly), and largely increased the number of microarray experiments to nine species. The increase of the number of expression data with multiple platforms could enhance the reliability of coexpression data. For the second point, we refined the data assessment procedures, for each coexpressed gene list and for the total performance of a platform. The assessment of coexpressed gene list now uses more reasonable P-values derived from platform-specific null distribution. These developments greatly reduced pseudo-predictions for directly associated genes, thus expanding the reliability of coexpression data to design new experiments and to discuss experimental results. |
| Barrett et al. (2013) NCBI GEO: archive for functional genomics data sets--update. Nucleic Acids Res 41:D991-5. (pmid: 23193258) |
|
[ PubMed ] [ DOI ] The Gene Expression Omnibus (GEO, http://www.ncbi.nlm.nih.gov/geo/) is an international public repository for high-throughput microarray and next-generation sequence functional genomic data sets submitted by the research community. The resource supports archiving of raw data, processed data and metadata which are indexed, cross-linked and searchable. All data are freely available for download in a variety of formats. GEO also provides several web-based tools and strategies to assist users to query, analyse and visualize data. This article reports current status and recent database developments, including the release of GEO2R, an R-based web application that helps users analyse GEO data. |
Footnotes and references
- ↑ Strictly speaking, splicing is an eukaryotic achievement, however there are examples of splicing in prokaryotes as well.
- ↑
(2015) The noncoding explosion. Nat Struct Mol Biol 22:1. (pmid: 25565024) Jarvis & Robertson (2011) The noncoding universe. BMC Biol 9:52. (pmid: 21798102)
Ask, if things don't work for you!
- If anything about the assignment is not clear to you, please ask on the mailing list. You can be certain that others will have had similar problems. Success comes from joining the conversation.
- Do consider how to ask your questions so that a meaningful answer is possible:
- How to create a Minimal, Complete, and Verifiable example on stackoverflow and ...
- How to make a great R reproducible example are required reading.
| < Assignment 9 | Assignment 11 > |